
CAMRES

Cam Resources Berhad
0.38
0.00
(0.00%)
90,900
Volume
Company Background

General Meetings: Outcome of Meeting
Quarterly rpt on consolidated results for the financial period ended 31/03/2024
Annual Report & CG Report - 2023
CIRCULAR TO SHAREHOLDERS IN RELATION TO PROPOSED RENEWAL OF EXISTING SHAREHOLDERS' MANDATE FOR RECURRENT RELATED PARTY TRANSACTIONS OF A REVENUE OR TRADING NATURE AND SHARE BUY-BACK STATEMENT IN RELATION TO PROPOSED RENEWAL OF SHARE BUY-BACK AUTHORITY FOR THE COMPANY TO PURCHASE ITS OWN SHARES
General Meetings: Notice of Meeting
OTHERSCAM Resources Berhad ("CAMRES" or "the Company")
(a) Proposed renewal of existing shareholders' mandate for recurrent related party transactions of a revenue or trading nature; and
(b) Proposed renewal of share buy-back authority for the Company to purchase its own shares.
Quarterly rpt on consolidated results for the financial period ended 31/12/2023
Change of Address
CAMRES - Notice of Book Closure
Interim Dividend
OTHERSCAM RESOURCES BERHAD ("CAM")
- SINGLE-TIER INTERIM DIVIDEND FOR THE FINANCIAL YEAR ENDING 31 DECEMBER 2023
Quarterly rpt on consolidated results for the financial period ended 30/09/2023
Change of Company Secretary - ZEENATH BEGUM BINTI MOHAMED MASTAN

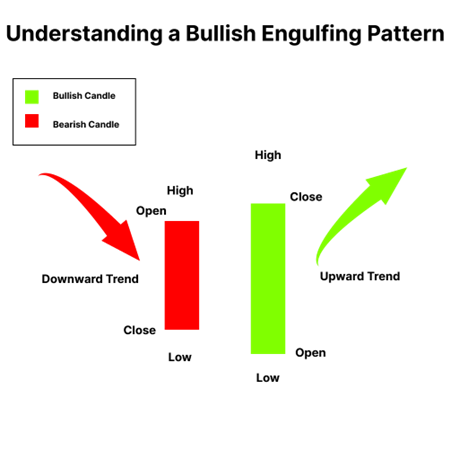
The secret to trade using the Bullish Engulfing pattern.
The Bullish Engulfing Pattern is one of those candlestick patterns that give us clues about a potential reversal in the price direction from a downtrend to an uptrend. Basically, this pattern consists of two consecutive candles. The first candle in this pattern is bearish (indicating a price decline), and the second candle is bullish (indicating the potential for a price reversal). The combination of these two candles reflects a shift in sentiment from bearish to bullish. In this pattern, it shows that buyers have taken control from sellers or can be interpreted as the selling pressure in the second candle is not significant anymore due to a larger buying force from traders. Ideally, this pattern is more reliable when accompanied by an increase in trading volume. High volume indicates greater market participation, validating the potential reversal in price. Moreover, the Bullish Engulfing Pattern can also be supported by other technical indicators, strengthening the argument for a reversal, for example, if it occurs near a support area, etc.
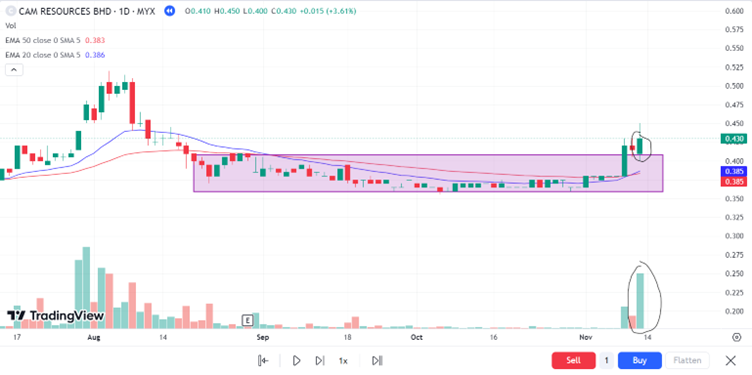
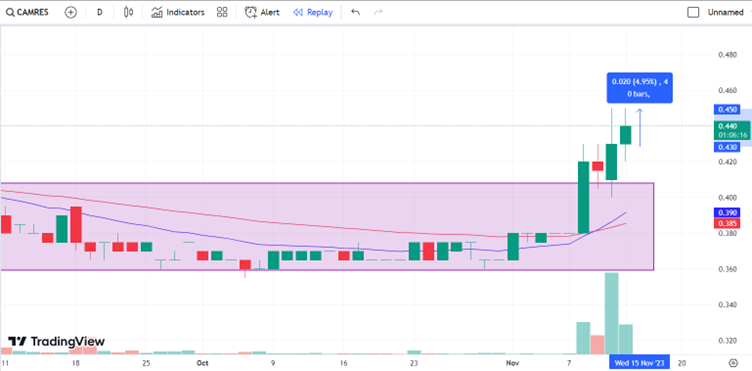
Something interesting happened with $CAMRES / 7128 (CAM RESOURCES BERHAD) stock today. Even though it's been going sideways for about 2.5 months, there's been a change in buy-sell performance since November 8th, showing more interest in buying. Also, there's a golden cross pattern with EMA-20 and EMA-50. On November 9th, the stock went down a bit (-1.19%), and the trading volume was lower than the day before. However, on Friday, November 10th, there was a bearish engulfing pattern. It is shown in the picture which has a bullish candle followed by a bearish one. What's good here is that the trading volume was also much higher than the previous days. Plus, the stock price was really close to a support line. Considering all these things – the golden cross, increased interest in buying, the bearish engulfing pattern, higher trading volume, and being near a support line – it might suggest the stock could be turning around.
And guess what happened? Today, on November 14th, CAMRES stock reached its highest point at $0.450 (an increase of approximately 4.95%). Isn't that an interesting pattern? Any opinion on this pattern? :D
1/3
OTHERSCAM Resources Berhad ("CAM" or "the Company") - Proposed Disposal of Properties by Central Melamineware Sdn. Bhd., a wholly-owned subsidiary of the Company
Quarterly rpt on consolidated results for the financial period ended 30/06/2023
Notice of SBB by a Company Pursuant to Section 127 (16) of CA 2016
Immediate Announcement on Shares Buy Back
Notice of SBB by a Company Pursuant to Section 127 (16) of CA 2016
Immediate Announcement on Shares Buy Back
Immediate Announcement on Shares Buy Back
Immediate Announcement on Shares Buy Back
Immediate Announcement on Shares Buy Back
Immediate Announcement on Shares Buy Back
Notice of SBB by a Company Pursuant to Section 127 (16) of CA 2016
General Meetings: Outcome of Meeting
Immediate Announcement on Shares Buy Back
Immediate Announcement on Shares Buy Back
Immediate Announcement on Shares Buy Back
Immediate Announcement on Shares Buy Back