📊 ANALISIS TEKNIKAL — $CSAP (Daily)
1. Tren Utama 📈
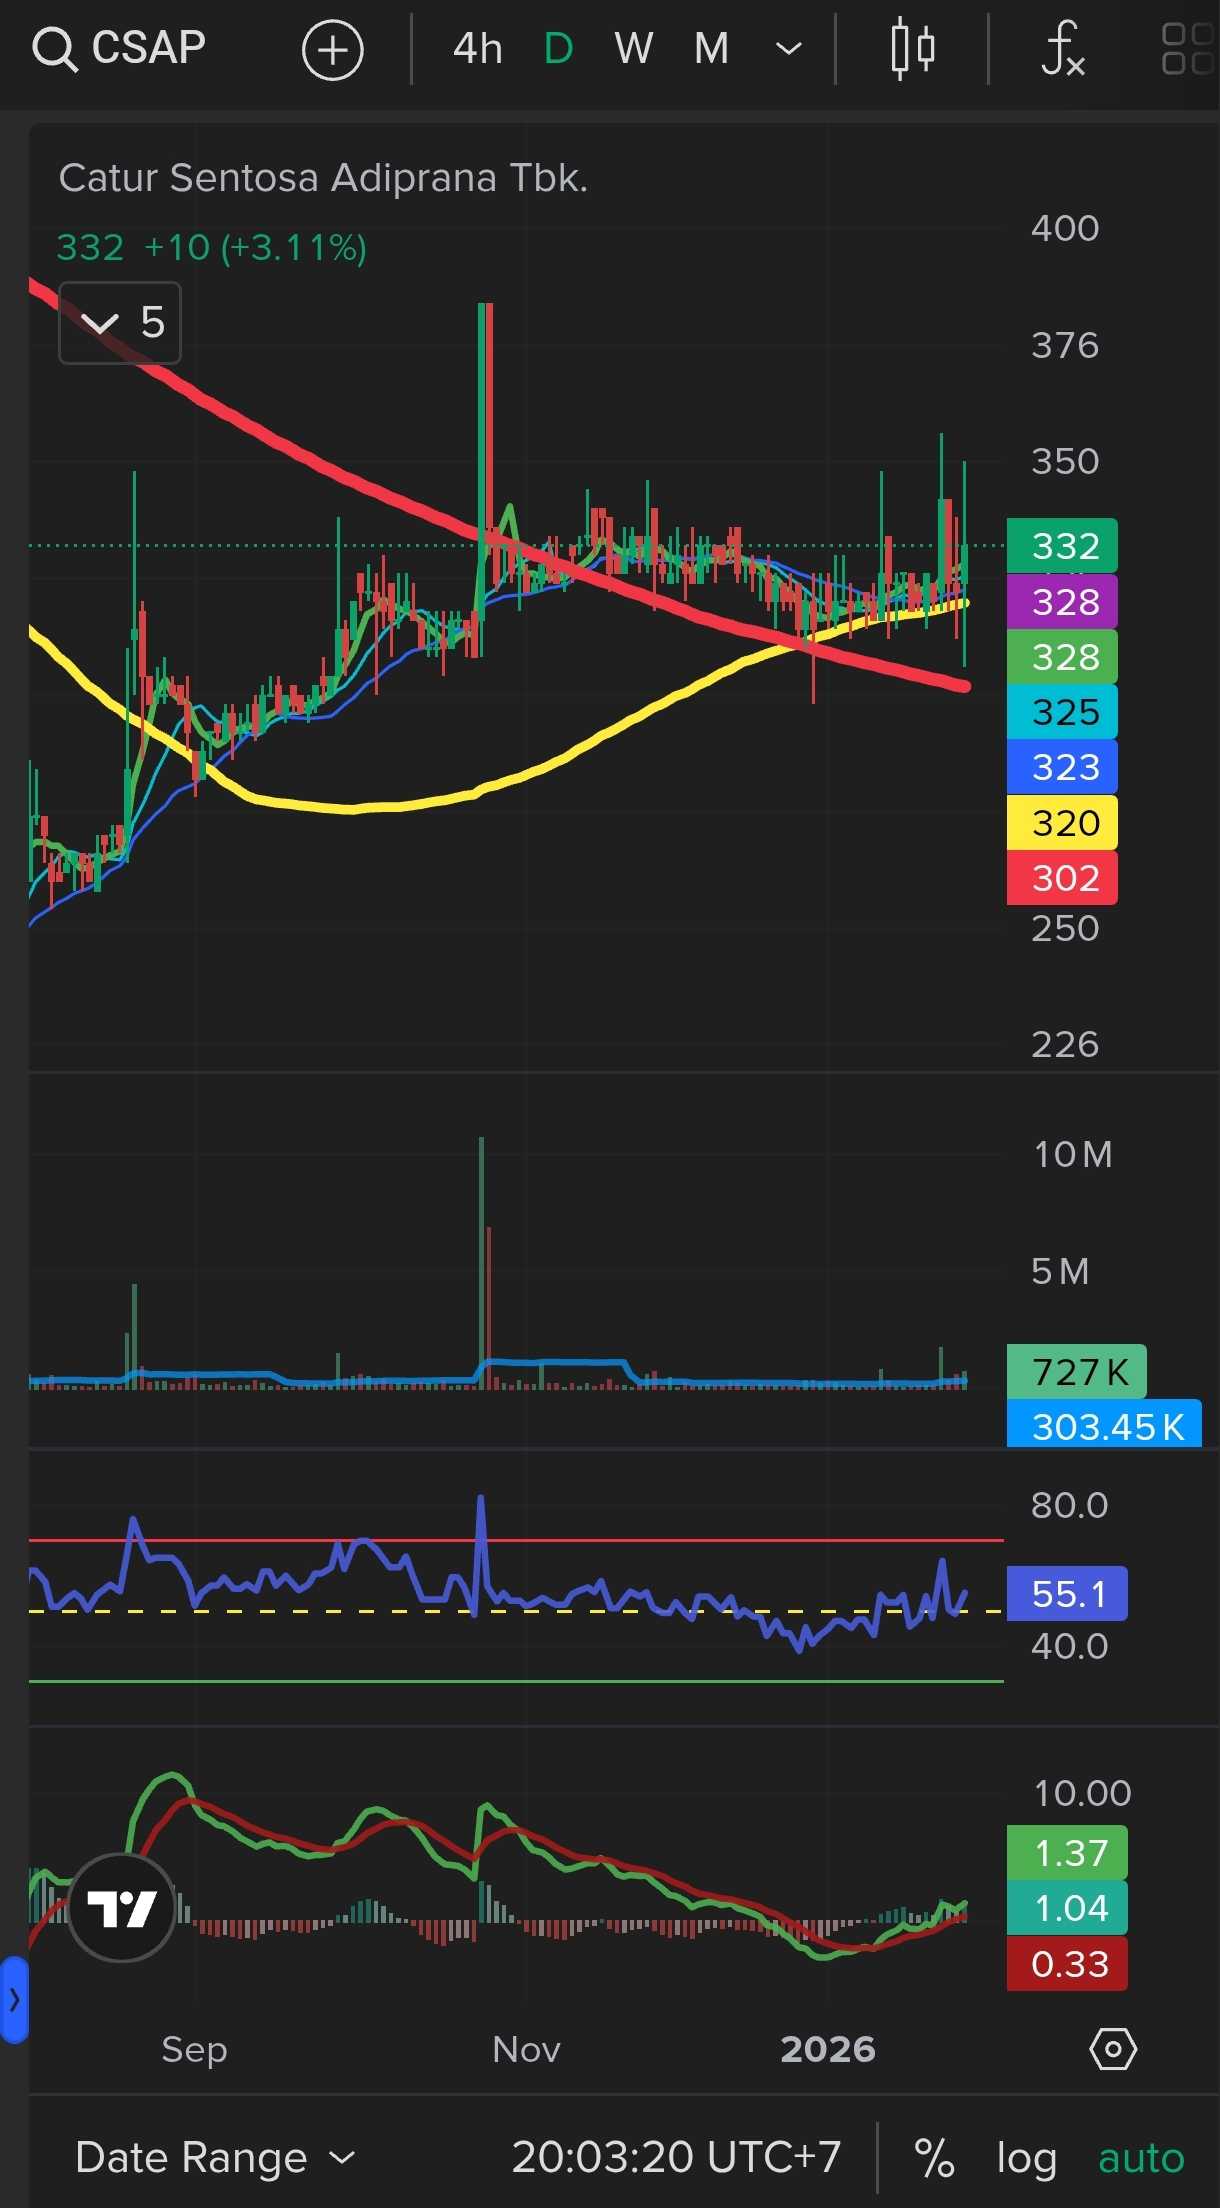
Kondisi tren: Transisi sideways → uptrend lemah
Struktur harga: Higher low mulai terbentuk, harga mencoba keluar dari tekanan trendline turun lama
➡️ Bias: 🟡 Netral ke Bullish
📌 Belum full trend naik, tapi ada tanda akumulasi di bawah resistance
2. Moving Average (MA) 📐
Posisi harga:
🟢 Di atas MA pendek
🟡 Berdekatan dengan MA menengah
🔴 MA panjang masih jadi overhead pressure sebelumnya
Susunan MA:
MA pendek ≈ MA menengah (flat)
➡️ Ciri fase konsolidasi akhir
📌 Area MA penting: 328 – 320
3. Momentum ⚡
Bollinger Band:
Band menyempit → potensi volatility expansion
RSI:
±55
➡️ Netral sehat, belum overbought
MACD:
Golden cross kecil, histogram hijau tipis
➡️ Momentum mulai bangun, tapi belum agresif
4. Volume 🔊
Volume relatif tipis & stabil
➡️ Belum ada distribusi
➡️ Breakout valid harus disertai lonjakan volume
5. Support & Resistance 🧱
🟢 Support:
S1: 328
S2: 320
S3: 302
🔴 Resistance:
R1: 335
R2: 350
R3: 370 (area supply lama)
6. Skenario Harga 🧭
🟢 Bullish (jika valid breakout)
Syarat:
Daily close >335 + volume naik
🎯 Target: 350 → 370
🟡 Sideways Lanjutan (paling mungkin)
Range: 320 – 335
➡️ Fase kumpul sebelum arah jelas
🔴 Bearish / Gagal Setup
Jika daily close <320
➡️ Potensi retest 302
7. Strategi Entry 🎯
🟡 Buy on Weakness
Buy: 320 – 328
SL: <302
TP: 350
🔵 Buy Breakout
Buy: close >335
SL: <328
TP: 350 – 370
🚫 Hindari entry di tengah range tanpa volume
8. Manajemen Risiko 🛡️
📊 Size kecil–sedang
✂️ Partial TP di 350
🔁 SL ke BE jika breakout valid
⚠️ Waspada fake breakout karena volume historis tipis
9. Kesimpulan 🧠
📌 $CSAP berada di fase krusial
🟡 Masih sideways, tapi tekanan turun mulai melemah
🟢 Breakout >335 akan konfirmasi arah naik
❗ Selama di atas 320, struktur masih aman
DYOR
$IHSG